Scouting System Update

TL;DR: Watch this demo video to see the system in action. Everything else is a technical deep dive.
Major Updates (Summer 2025)
We've spent the off-season refining our scouting system with a focus on handling human error systematically. While it's not building from scratch, these are entirely new ways to scout. Read for yourself!
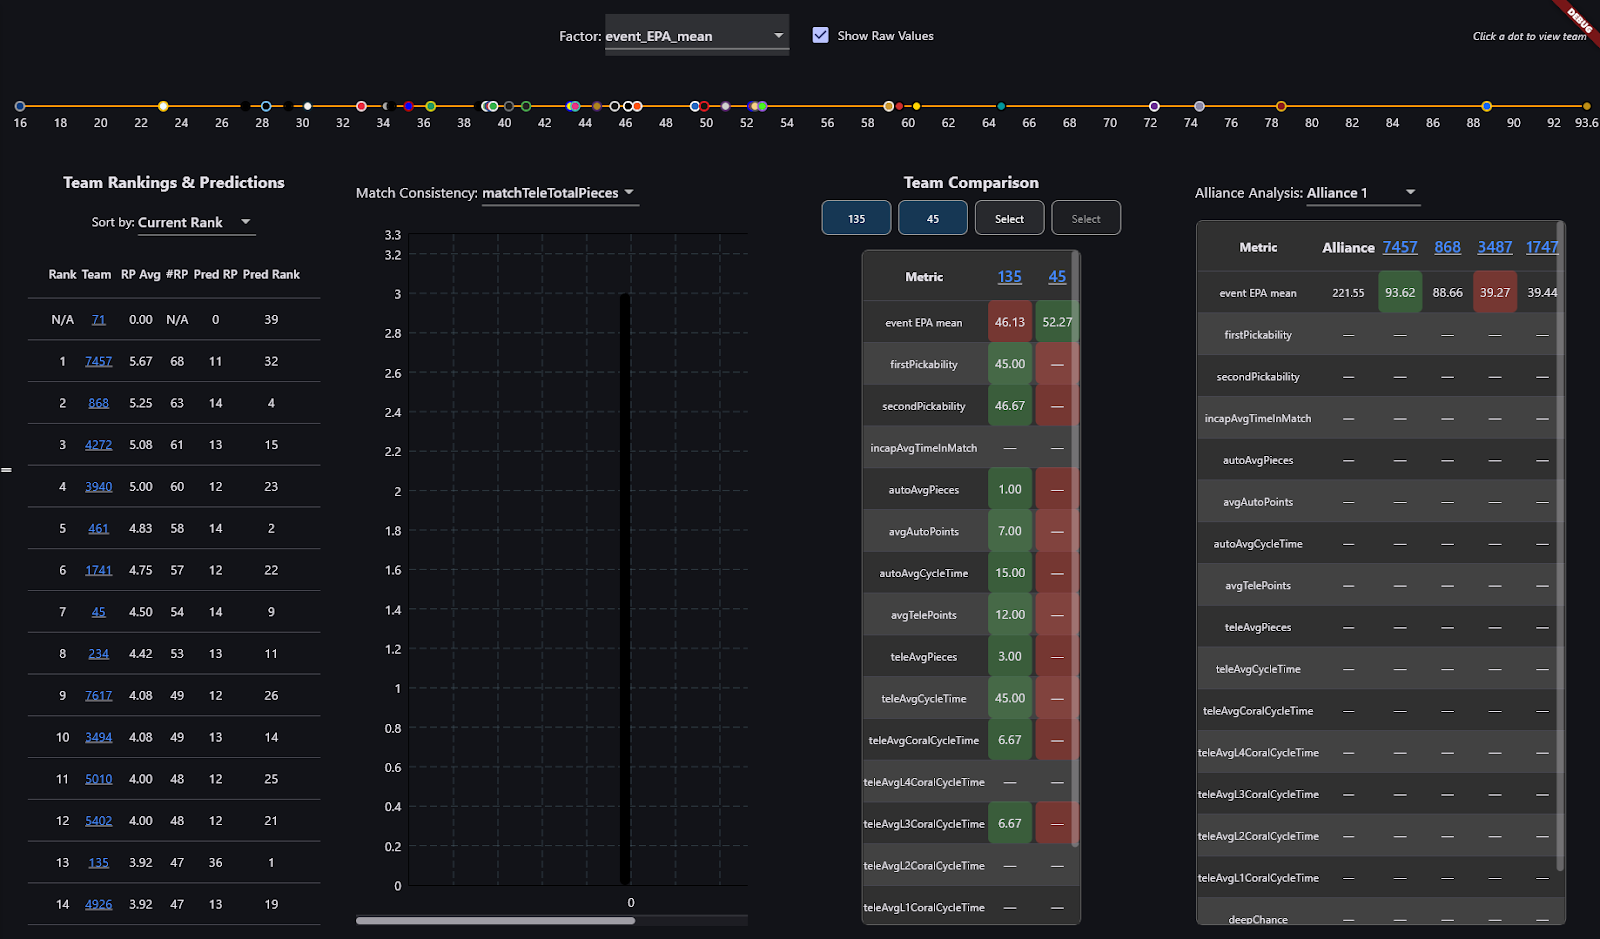
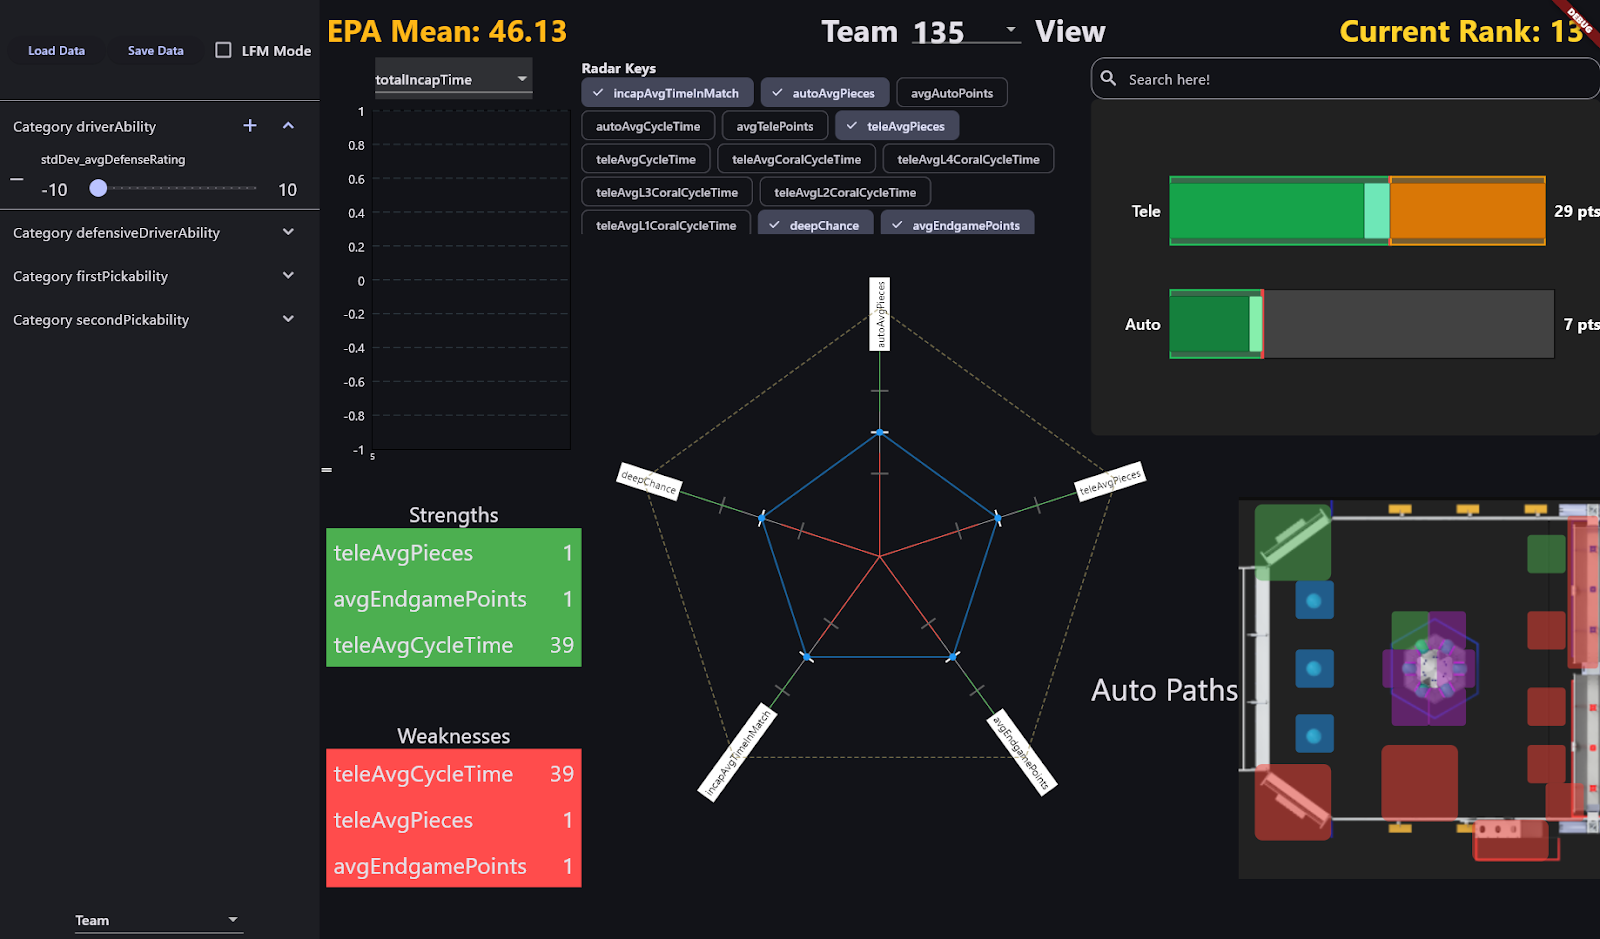
1. Complete UI
We designed all event-related tabs (Overall & Team views), moving from initial brainstorms to a production-ready interface. The new design prioritizes clarity and speed for both pit crew and scouts. Originally, back in 2024, we had to use Sheets to view data...
2. Cloud Infrastructure Migration
All core data flows now run in the cloud, dramatically improving speed and reliability.
What's automated:
- Objective scouter data
- Subjective scouter data
- Event-wide analytics (best teams, coral specialists, etc.)
- Automated backups
Impact: Data processing time went from 12 hours (sitting in hotels analyzing) to 5 seconds (post match analysis). Scouters submit their data, and the pit display updates almost instantly.
PS: USB transfer / QR transfers works alongside cloud sync for redundancy. (Some events don't have reliable Internet)
3. Unified Data Tracking
Every piece of data arriving at the pit display now includes:
- Who scouted it
- When they scouted it (enables match replay features!)
- What event is it from
This solved a critical flaw: You can now enter match data out of order. Scout match 74 before match 1? No problem. The system handles it.
The Math
Scout Precision Rankings (SPR)
Inspired by Team 1678's approach but rebuilt from scratch for greater accuracy.
The Core Problem
Traditional scouting assumes all scouts are equally reliable. In reality, some scouts are consistently accurate, some systematically over- or undercount, and others are just noisy. Without quantifying this, you're averaging together good data with bad data and hoping for the best.
How We Measure Scout Quality
Per-Match Error Calculation:
Here's the key insight: In each match, we have 6 scouters watching 3 robots (2 scouters per robot). We know from The Blue Alliance (TBA) what the alliance scored a total in Auto, Teleop, and Endgame.
The math works like this:
- Take all possible combinations of the 3 robots' reported scores
- Sum them up for each game period (Auto/Tele/Endgame)
- Compare each combination against the known TBA alliance total
- The "error" is how far off each scouter's report was from reality
Example: If TBA says Blue Alliance scored 45 points in Auto, and our three scouts reported robots scoring 15, 12, and 20 points (total = 47), we know there's a +2 point error distributed among those scouts. By testing all combinations across multiple matches, we can isolate which scout tends to be off.
This works because points are fungible (we HATE NFTs), it doesn't matter exactly which robot scored what, as long as the total is accurate. An L4 coral = specific points, so we can work backwards from alliance totals even without knowing the exact game piece distribution.
What SPR Catches:
- Scouts who consistently miss cycles (systematic undercounting)
- Scouts who overcount or "overcycle" (systematic overcounting)
- Scouts who don't understand scoring mechanics (high variance + bias)
- Systematic biases in reporting (always +X or -X from reality)
What SPR Can't Distinguish:
- Two L2s vs. one L4 (same point value = invisible to the math)
- Specific game piece types when they have equal point values
- Individual robot contributions within an alliance (we only know alliance totals)
SPR Score: Lower = more precise. It's the average of all per-match errors for that scouter across the event. A scout with an SPR of 2.3 is typically within 2-3 points of reality per match. A scout with SPR of 8.7 is... not ideal.
Additional Metrics Per Scouter:
- Bias: Do they systematically over-/undercount? (e.g., always reports +5 points higher than reality)
- Positive bias = overcounting
- Negative bias = undercounting
- Near-zero bias = accurate on average, even if individual matches vary
- Variance: Are they consistent, or do they swing wildly?
- Low variance = reliable and repeatable
- High variance = unpredictable, could be accurate one match and way off the next
- A scout can have low bias but high variance (accurate on average, but unreliable per-match)
So, Low bias + low variance = consistently accurate scouting.
Known Limitation: If most scouts in a match perform poorly, even good scouts get penalized. Why? Because we're comparing against combinations of reports, not the absolute truth. If 5 out of 6 scouts are terrible, the good scout's accurate data looks like an outlier and gets flagged as high error. If you've got better ideas, shoot them our way!
Our Mitigation: We analyze SPRs holistically across all matches. A single bad match won't tank a good scout's overall ranking, and patterns emerge over time. The AI (see next section) accounts for this by gradually updating models and cross-referencing across many matches.
Synthetic Data & AI Integration
The Problem
You have six different scouts watching the same match. Scout A says Robot 1 scored 3 L4 corals. Scout B says 4 L4s. One of them blinked at the wrong moment. One of them is consistently accurate. One of them doesn't understand what counts as "scored." and was playing Clash.
How do you combine six different reports into the truest representation of what actually happened? Simple averaging doesn't work, you're letting bad data corrupt good data.
Our Solution: Synthetic Match Data
We built a custom AI that learns from scout behavior patterns and creates "synthetic" match results that are statistically more accurate than any individual scout or simple average.
The Process (Simplified):
- Learning Phase: The AI observes each scout across many matches and builds a model:
- What's their systematic bias? (always +3 points? always -2 cycles?)
- What's their variance? (consistent within ±1, or wildly swinging ±10?)
- How does their accuracy change over an event? (improving with practice? getting fatigued?)
- Synthesis Phase: For each match, the AI:
- Takes all 6 scout reports (2 per robot)
- Debiases each report by removing known systematic offsets
- Weighs each report by the scout's historical consistency (variance)
- Combines weighted reports into a "synthetic" result
- Generates uncertainty estimates (confidence intervals) for the synthetic data
- Backfilling Phase: As the AI learns more about scouters throughout the event:
- It re-processes older matches with updated models
- Early match estimates improve as more data accumulates
- By the end of qualifications, even Match 1 data is highly refined
Example in Action:
Match 15, Robot 2548:
- Scout A (SPR: 2.1, Bias: +0.3) reports: 4 L4 corals, 25s cycle time
- Scout B (SPR: 7.8, Bias: -2.1) reports: 2 L4 corals, 30s cycle time
Traditional average: 3 L4s, 27.5s cycle time
Synthetic result: 3.8 L4s, 26s cycle time (heavily weighted toward Scout A, with Scout B's systematic undercounting corrected)
Fallback Behavior:
If synthetic data isn't ready yet (missing TBA confirmation or incomplete scout reports), the system uses the first scouter's data as a placeholder. The moment synthetic data is available, it seamlessly replaces the placeholder in the background. Users never see a "loading" state — they always see results, which simply get more accurate over time.
What This Enables
FRC isn't just about point totals, though. Because we're working with individual scout observations (not just alliance totals), we can extract team-specific metrics with unprecedented accuracy:
- Team-specific L4 counts per match (not just alliance totals)
- Average cycle times with confidence intervals
- Algae scoring patterns (frequency, timing, success rate)
- Reliability metrics (consistency across matches, failure modes)
- Endgame performance (success rate, timing, type)
- Defense effectiveness (impact on opponent cycle times)
- Everything — with significantly higher accuracy than any single scouter could achieve
Why Not Simple Averaging?
Simple averaging fails because:
- It treats all scouts equally. The best scout's data gets diluted by the worst scout's data
- It can't remove systematic bias. If 3 scouts always overcount by 2, averaging gives you... data that's still +2 too high
- It amplifies outliers. One confused scout reporting 10x reality pulls the average way off
- It provides no confidence measure. You have no idea if "3.5 L4s" is trustworthy or garbage
Our approach solves this:
- Removes systematic errors through debiasing (if we know Scout X always reports +2, subtract 2)
- Auto-downweights noisy scouts (high variance = low weight in synthesis)
- Outlier resistance (extreme reports from low-reliability scouts get minimal weight)
- Provides uncertainty measures (you see confidence intervals, so you know when to trust data)
- Backfilling ensures historical accuracy improves over time (early matches get better as we learn more about scouts)
The Math Behind Debiasing
When we "debias" we're not subtracting a constant. The AI learns:
Linear bias: Scout consistently reports N points/cycles too high
- Proportional bias: Scout overcounts by X% (affects high-scoring teams more)
- Context-dependent bias: Scout is accurate for simple tasks, but struggles with complex scenarios
- Time-dependent bias: Scout's accuracy degrades over the day (fatigue)
For each scout report, we apply corrections based on their learned model, then weight by confidence (inverse variance). The result is a Bayesian-ish combination of evidence that approaches ground truth.
Computing Residuals and Model Updates
After each match is synthesized (or TBA data arrives), we compute residuals, how far was each scout's report from the chosen "truth" (synthetic result or TBA)?
These residuals feed back into the model:
- Large residual = scout was way off this match → slightly increase their variance (less trust)
- Consistent residuals in one direction = update bias estimate
- Small residual = scout was accurate → slightly decrease variance (more trust)
Critical design choice: Updates are gradual. A single bad match doesn't destroy a scout's reputation. We use exponential moving averages (or similar) so the model is stable but adaptive.
Backfilling trigger: When a scout's model improves significantly (variance drops below threshold, bias correction changes by >X%), we re-synthesize all their previous matches. This is why Match 1 data gets better as the event progresses.
What This Is NOT
This is NOT like 1678's DoozerNet: (not to say theirs is at all bad)
- DoozerNet is a Q-learning model for match outcome prediction (who wins?)
- Ours is a statistical debiasing system for data extraction (what happened?)
DoozerNet excels at: Predicting match winners in eliminations (Q-learning improves with more matches)
Our system excels at: Extracting accurate team performance metrics early in an event (statistical power from bias/variance modeling)
Why the difference matters:
Both approaches are trying to predict the future, but from different angles:
- Q-learning says, "Based on past match outcomes, Blue Alliance will probably win."
- Statistical synthesis says: "Based on corrected robot capabilities, Blue Alliance has 73% win probability."
We prioritized the second approach because it provides interpretable, actionable data. You know WHY Blue will probably win (Team X's L4 rate, Team Y's endgame consistency, Team Z's defense). Q-learning gives you a prediction, but it's a black box.
Future possibility: Incorporate both. Use synthetic data for early-event analysis and team capabilities understanding, then layer on Q-learning for elimination bracket predictions. Best of both worlds.
Event Simulation
We can predict event outcomes with unprecedented precision with highly accurate synthetic data that tells us what robots actually DID (not just alliance totals).
Monte Carlo Simulation (10,000 iterations per match)
Traditional match prediction uses expected values: "Team X averages 12 points, Team Y averages 15, so the alliance should score 27." But that's not how robots work. Some matches they pop off, some matches they break, some matches they get defended.
Our approach: Simulate the match thousands of times using actual performance distributions.
For each of 10,000 simulated matches:
- Random sampling: For each robot in both alliances, randomly select ONE of their actual past matches
- Example: Team 135 played Match 3, where they scored 4 L4s, Match 7, where they scored 2 L4s, etc.
- We randomly pick "Match 7 Team 135" for this simulation iteration
- Alliance construction: Sum up the randomly selected match performances
- Red Alliance: Team A's Match 12 + Team B's Match 8 + Team C's Match 15
- Blue Alliance: Team X's Match 3 + Team Y's Match 22 + Team Z's Match 9
- Score calculation: Add up all the points from those specific match performances
- Auto points, Teleop points, Endgame points
- Apply penalties if any (can be randomized based on historical penalty rates)
- Winner determination: Whoever has more points wins (duh)
- Ranking Point calculation: This is where it gets interesting...
RP Calculation Detail:
Because we have granular synthetic data, we know not just alliance totals, but individual robot contributions:
- How many L4 corals did each robot place? (We can sum across the alliance)
- Did they process algae? How many?
- What endgame did each robot achieve?
So we can directly apply game rules:
Example (Reefscape 2025):
Coral Bonus RP: Did alliance place ≥15 total coral pieces on reef?
→ Sum Team A's 4 corals + Team B's 6 corals + Team C's 5 corals = 15 → YES, RP awarded
Algae Bonus RP: Did alliance process ≥8 algae pieces?
→ Sum Team A's 3 algae + Team B's 2 algae + Team C's 4 algae = 9 → YES, RP awarded
Endgame Bonus: Did all 3 robots achieve at least Low Cage?
→ Check each robot's endgame state from synthetic data → YES/NO
This is VASTLY more useful for strategy than "Team X will probably win Match 42."
Philosophy: Rankings Over Match Prediction
Why rank prediction matters more:
- Alliance selection happens based on RANK, not match wins
- Qualification strategy (throw matches, avoid penalties, conservative play) depends on the ranking trajectory
- Schedule strength analysis requires knowing if a tough schedule will drop you out of the top 8
The accuracy vs. power tradeoff:
Other elite teams focus heavily on Q-learning for match winner prediction:
- Q-learning: "Given alliance composition, what's the probability Blue wins?"
- Trained on historical match outcomes across events
- Gets more accurate as the season progresses (more training data)
- Excellent for elimination brackets where you need to know "can we win with this alliance?"
Our approach focuses on rank prediction:
- Monte Carlo + synthetic data: "Given robot capabilities, what's each team's expected RP total?"
- Trained on robot-level performance within an event
- Statistical power from correcting scout bias/variance
- Excellent for a qualification strategy where you need to know "where will we end up?"
The practical difference:
1678's system at Champs (late season, lots of training data):
- "Blue Alliance has an 87% chance to win this elimination match." ← Extremely accurate
Our system at Week 1 (early season, limited training data):
- "Team X has 73% confidence interval of ranking 4th-8th". ← High statistical power despite limited data
Both are valuable. Neither is "better." It's about what question you're trying to answer.
Design Philosophy (Revisited)
Statement A: "95% confident Team X will rank 1st, Team Y will rank 3rd"
- Actionable in quals (do we need to pick them? Should we throw matches to avoid 1st?)
- Based on current data (no waiting for season-long training)
- Interpretable (we can explain WHY: L4 rate, endgame consistency, cycle times)
Statement B: "95% confident Blue alliance wins Elimination Match 5"
- Actionable in elims (do we pick this alliance?)
- Requires season-long training (not useful in Week 1)
- Black box (hard to explain WHY beyond "the model says so")
Read that again. They aren't the same question. They aren't even the same PART of the competition.
We chose Statement A because:
- 60 qualification matches vs 6-8 elimination matches → more opportunities to use data
- Seeding matters more than ever with 8-alliance brackets
- Early-season utility matters for regional teams (we don't all go to Champs)
- Interpretability helps with coaching and strategy discussions
Why Not Both?
We might! The architectures aren't mutually exclusive:
Hybrid approach (future possibility):
- Use synthetic Monte Carlo for qualifications and team capability analysis
- Incorporate Q-learning (trained across events) for elimination predictions
- Fallback gracefully: Week 1 = pure Monte Carlo, Champs = hybrid with Q-learning weight increasing
The challenge: Maintenance burden. Two systems means twice the code, twice the debugging, twice the complexity. We're a student team. Prioritization matters.
For now, we've chosen deep over wide to make rank prediction really good rather than make everything mediocre.
Technical Notes
- Monte Carlo simulations run 10,000 iterations per match
- AI uses residual analysis with gradual model updates (prevents single-match overfitting)
- Backfill algorithm re-processes historical matches as scouter models improve
Questions? Feel free to reach out. We're happy to share more technical details or discuss implementation challenges.
— Team 135 Black Knights Software Team